NOIDA (CoinChapter.com)—Recent Bitcoin price action saw the token’s price drop to $82,100, a level last seen in early Nov. 2024. The plunge sent traders panicking, with the wider consensus on Bitcoin’s immediate future being bearish. BTC is now trading below $87,000, marking a 20% decline from its all-time high of $109,000 earlier this year.
ETF outflows have reached record levels, wiping out billions in institutional capital that once fueled Bitcoin’s rally. The U.S. dollar is gaining strength, making risk assets less attractive as macro jitters rattle global markets. On-chain data now confirms a shift in sentiment, with long liquidations surging, whales offloading holdings, and spot selling pressure mounting.
The token faces pressure from multiple fronts, each signal suggesting a prolonged downturn for BTC prices. Bitcoin could struggle to reclaim the $90,000 level in the near term without a strong reversal in institutional inflows or macro relief.
Bitcoin ETF Outflows Signal Institutional Weakness
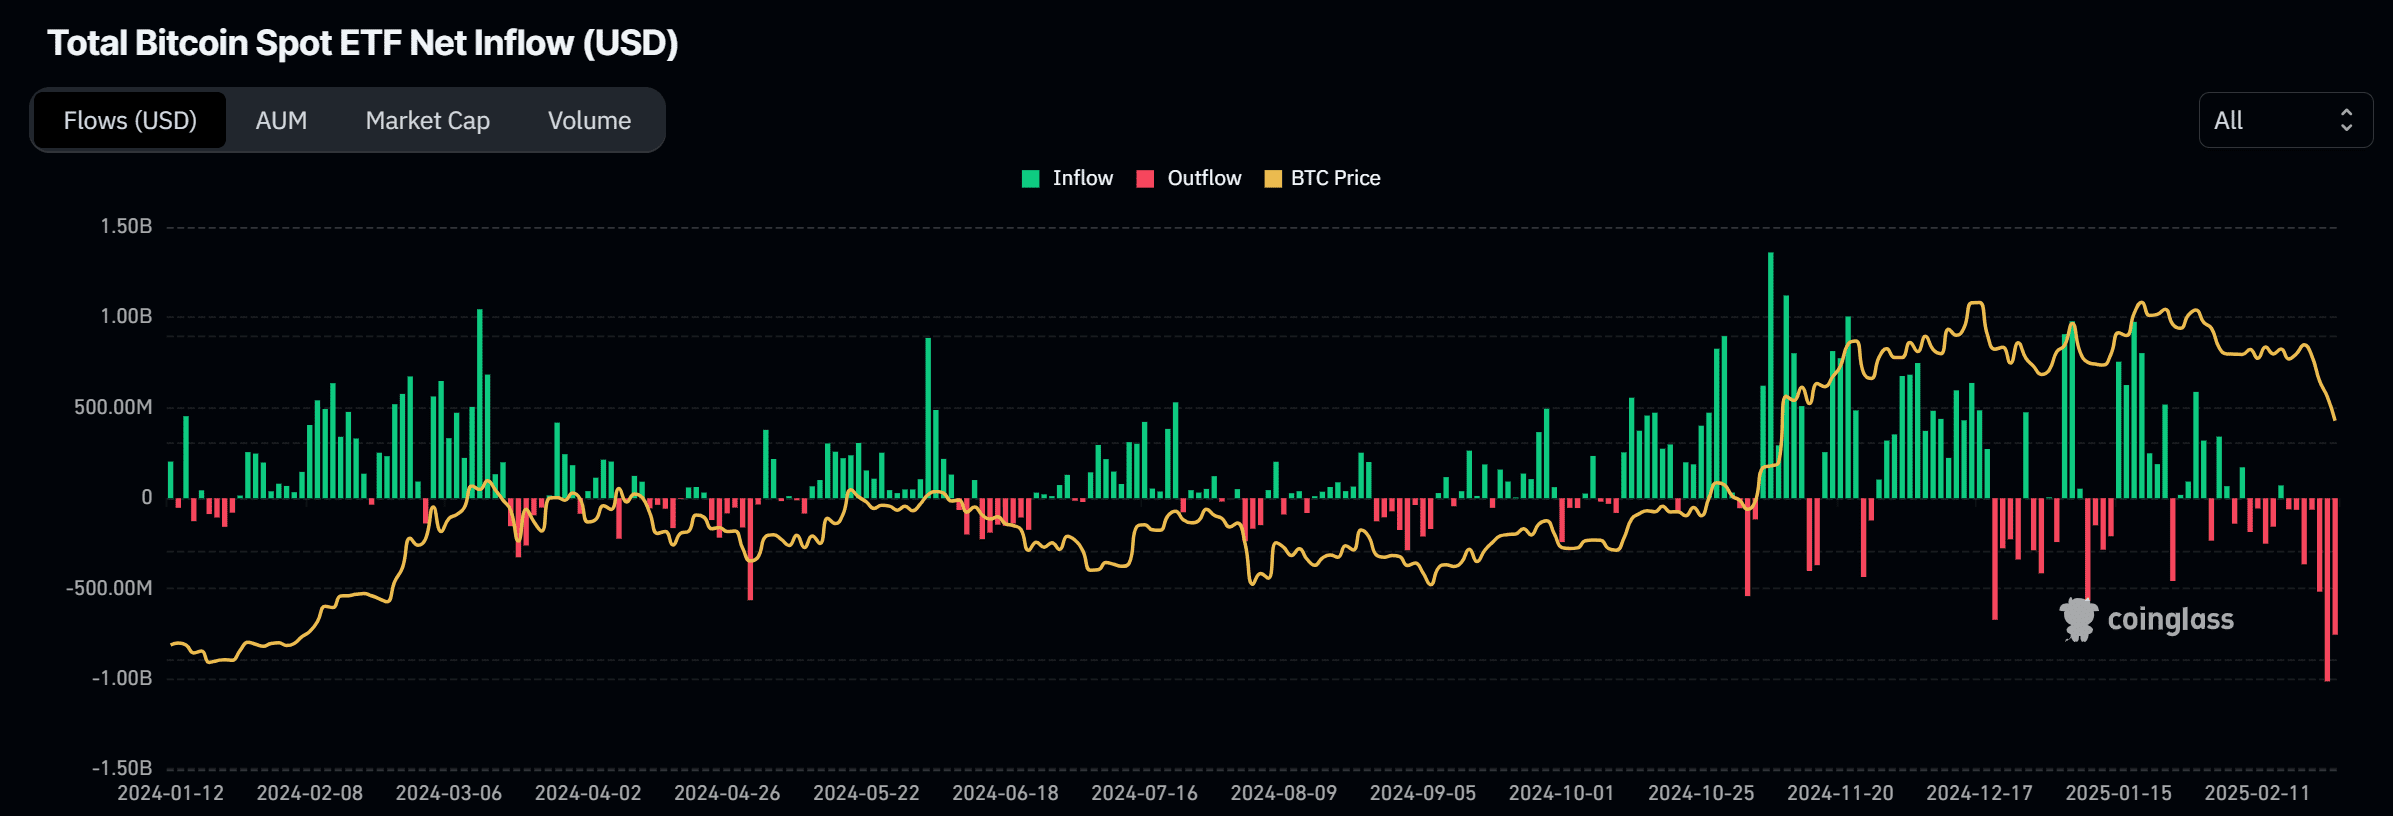
BTC ETFs were once a major catalyst for the token’s historic rally, pulling in over $40 billion in net inflows in 2024. Now, the tide is turning. On Feb. 25, Bitcoin ETFs recorded a staggering $937.9 million in net outflows, followed by another $754.6 million the next day. Fidelity’s Wise Origin Bitcoin Fund (FBTC) and BlackRock’s iShares Bitcoin Trust (IBIT) led the sell-off, with IBIT alone losing $418.1 million.
Bitcoin ETF Outflows Surge as Institutional Selling Accelerates. Source: CoinglassThes shift is critical because ETF issuers hold actual BTC, meaning when investors withdraw, they sell Bitcoin to cover redemptions—adding direct selling pressure to the market. As the ETF-based “basis trade” loses appeal, institutions are either cashing out or reallocating capital toward safer assets.
According to Neil Roarty, a cryptocurrency analyst at ClickOut Media, the trend reflects shifting sentiment rather than a complete abandonment of Bitcoin:
The launch of Bitcoin spot ETFs in the US a little over a year ago was seen as a major driver of BTC’s remarkable price growth in 2024, and we’re already seeing retracement as institutional investors search for safer havens. Does this mean the party’s over? Not necessarily. The entire equities market is also taking a battering as consumer confidence plummets and fears of an international trade war rise.
The ETF net inflow chart supports this shift. After a long stretch of strong inflows, the last few weeks have seen persistent outflows, coinciding with Bitcoin’s decline. If institutions continue exiting at this scale, Bitcoin could face extended selling pressure, potentially dragging prices toward $70,000 or lower.
Strengthening U.S. Dollar Adds Another Headwind for Bitcoin
Bitcoin’s struggles deepen as the U.S. dollar strengthens, maintaining its historically inverse correlation with BTC. The BTC vs. DXY chart shows a clear pattern: nearly every major Bitcoin rally coincided with a weakening dollar, while each sharp decline aligned with a period of dollar strength. The current situation mirrors past downturns, with the dollar rising and Bitcoin facing sustained selling pressure.
Bitcoin faces pressure as U.S. dollar strengthens, echoing past downturns. Source: TradingviewThe DXY index is climbing, reflecting increased demand for U.S. assets, while the 10-year Treasury yield is also pushing higher. As macro uncertainty increases, investors are moving toward safer dollar-based investments, reducing Bitcoin’s appeal in a risk-off environment.
Milad Azar, a market analyst at XTB MENA, pointed out in a note to CoinChapter the recent economic reports fueling the dollar’s strength. Azar noted that a sharp decline in consumer confidence and mixed PMI numbers have raised concerns over economic growth, reinforcing the dollar’s dominance in global markets.
These conditions are creating a two-fold problem for Bitcoin. A stronger dollar directly weakens Bitcoin’s appeal, as rising Treasury yields offer guaranteed returns, making BTC’s volatility less attractive. With yields above 4.3 percent, investors seeking stability choose traditional assets over speculative ones. At the same time, global macro jitters are weighing on broader risk sentiment, further pressuring Bitcoin.
Moreover, Michael Brown, Senior Research Strategist at Pepperstone, highlighted how economic uncertainty affects investor behavior. In a note to CoinChapter, Brown pointed out that jitters over the U.S. economy have driven a portion of Treasury demand, with last week’s soft data and weaker-than-expected Walmart guidance worsening market sentiment.
Bitcoin thrives in liquidity-driven, risk-on environments, but with the Federal Reserve delaying rate cuts and trade war fears rising, the current conditions remain unfavorable. Unless the Fed pivots aggressively or broader risk appetite returns, Bitcoin could remain under pressure, struggling to reclaim the $90,000 level as long as dollar strength persists.
On-Chain Data Signals More Downside Ahead
Bitcoin’s decline below $87,000 is not just a reaction to ETF outflows and macro uncertainty. On-chain data reveals intensifying selling pressure, suggesting more downside risk. Key indicators confirm that bearish sentiment is strengthening: rising long liquidations, increasing whale deposits to exchanges, and spot selling pressure outpacing demand.
Bitcoin futures long liquidations total.The BTC Futures Long Liquidations chart shows a sharp spike in forced liquidations as Bitcoin dropped below key support levels. This signals that overleveraged traders were wiped out, triggering cascading sell orders. Historically, such liquidation spikes have preceded further declines, reinforcing the risk of extended downside.
Whale behavior also points to continued selling. The BTC Whale Transfer Volume to Exchanges chart shows a surge in large BTC deposits to exchanges.
Bitcoin transfer volume from whales to exchanges. Source: GlassnodeWhales typically move coins to exchanges when they intend to sell, rather than accumulate. This suggests that large holders are offloading Bitcoin into market weakness, a clear bearish signal.
Spot market activity further confirms the trend.
BTC spot cumulative volume delta.The BTC Spot Cumulative Volume Delta chart shows net selling pressure dominating. More Bitcoin is being sold in spot markets than bought, meaning real BTC holders are exiting rather than accumulating.
Bitcoin’s downtrend could continue with forced selling, whale exits, and increasing spot market sell pressure. These signals indicate that the market remains under strong bearish control, with little sign of relief.
The post 3 Reasons Why Bitcoin Price Could Collapse Further Amid Growing Sell Pressure appeared first on Coinchapter.
%%featured_image%%


